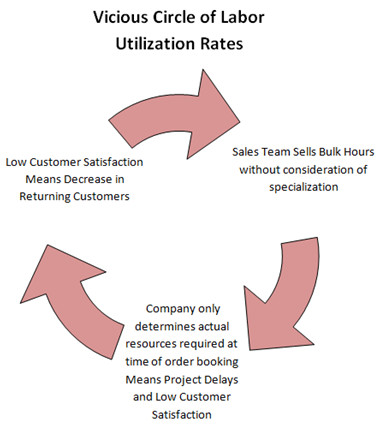
Ending the Vicious Circle of low Billable Utilization.
In order to increase billable labor utilization rates and make the professional services team more profitable, many companies put most of the responsibility on the sales team to sell more services in order to keep the field technicians fully booked.
Although this seems like a reasonable strategy on the surface, unfortunately it’s not that simple. Different resources have different skill sets resulting in different sized “hours buckets” of sell-able and billable services.
To complicate matters, existing service deliverables may change as existing projects take longer to complete, or finish sooner than expected. In order to know what types of services are available to sell in what time frame, you’d have to be able to combine an existing ‘work in progress’ services calendar, with a ‘planned’ work calendar and align that with a labor forecast for the high probability jobs that are in the sales funnel. For this to be truly useful, you’d have to break that combined labor overview into the previously mentioned “hours buckets” of the different types of services offered.
As I said, not as easy as one might think on the surface.
Trying to do manage this manually often results in extremely high billable labor utilization rates one month and a low billable utilization rates the next month, kind of like a billable utilization roller coaster. The extremely high billable utilization months can sometimes come at the expense of customer satisfaction (e.g. finishing or starting jobs late) or employee satisfaction (too many late nights & weekends). So the short term benefits of having a high billable utilization one month can be off-set by a longer term negative impact on repeat business. It can also affect employee satisfaction which can negatively impact resource availability (when they get sick or quit from overwork). This manual resource management approach can create a vicious circle and actually limit professional services profitability.
The balancing act between optimal current and future labor utilization really comes down to accurate labor resource management combined with accurate labor resource forecasting.
Let’s look at a typical resource management & forecasting scenario:
“I have ten field technicians and each of those techs has 40 hours a week to work. So, that’s 400 hours a week of potential billable hours. Let’s get the sales team to book as many of those potential billable hours as possible.”
Click on the image below to download the Promys Billable Utilization Guide
Single Hours Bucket Resource Management – The Problem with this Approach
The issue with this blanket approach is that not all field technicians are created equal. Some have specialized skills, Cisco or other certifications, PMP (Project Management), structured cabling, or other specialized training knowledge. So in reality, a bucket of 400 hours is pretty much useless for real-world labor planning & forecasting because those 400 hours might actually be comprised of 80 project management hours, 240 installation hours, 40 structured cabling hours and 40 training hours.
Achieving More than 65% Billable Labor Utilization through Accurate Resource Management
Industry average metrics say that a 65% Billable Labor Utilization rate will allow most companies to break-even, a 75% Billable Utilization rate results in the company making some profit and anything over 80% and the company should be very profitable.
So in order achieve more than 65% labor utilization, you need the ability to manage & forecast expected hours by specialized resources and ideally you also need to be able to plan & forecast those hours 30, 60, and 90 days in advance. To achieve both services profitability and customer satisfaction, you need to know:
- How many project management, installation, and training hours are currently deployed and what do you need next month?
- What is the impact of internal or external change orders on current projects and also be able to incorporate forecast labor changes based on quote revisions.
- Calculate the delta of available hours.
This becomes information of strategic value in order to make business decisions that will make your services organization more profitable and move you towards the ideal 80%+ utilization rate, as per the example below.
“We’re forecasting a little light in structured cabling 30 days from now. We have the opportunity to take a low-margin cabling job we were going to turn down. We should take it so that we don’t have our cabling people sitting on the bench next month.”
Automating Labor Utilization Means Optimizing Labor Utilization for the Growing IT Service Provider
In a smaller company where most field technicians are “jack of all trades”, labor scheduling & forecasting can for the most part be done manually. As your business grows and the technicians become more specialized, manually tracking and forecasting these specialized labor hours becomes nearly impossible.
Even if you could manually compile an accurate snapshot of currently deployed specialized labor resources and combine that with forecasted labor resources, now you have to contend with existing service deliverables changing in the field, combined with quote versions and corresponding labor scope change over the course of the sales process. So updating the resource tracking & forecast manually, at the level of resource specialization detail required to make the resource forecast truly useful, becomes truly unfeasible.
Automation becomes the only way to adequately address the labor utilization and resource forecasting issue to allow you to plan, track and forecast specialized resource hours to achieve optimal billable labor utilization. Ultimately, this automation will result in increased services team profitability and customer satisfaction, which in turn, means repeat business and the vicious circle has transformed into a circle of profit for your IT services organization.


